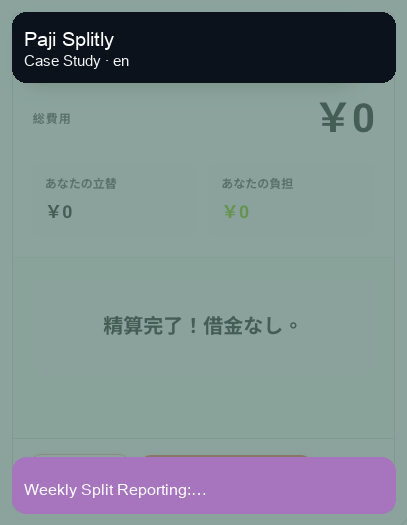
📌 This is a simulated use case designed to illustrate how features can be used. The actual interface and workflow may differ slightly depending on the version.
Weekly Split Reporting: Detailed Charts + Export Bill (Premium) Workflow
Teams that only record expenses but never review trends usually face month-end surprises. A weekly reporting cadence reduces that risk significantly.
This Paji Splitly case shows a 15-minute routine: analyze, verify, export, and follow up.
Weekly reporting is valuable not because it summarizes the past, but because it surfaces drift early enough to act before month-end pressure spikes.
A Small Team That Needs Weekly Operational Visibility
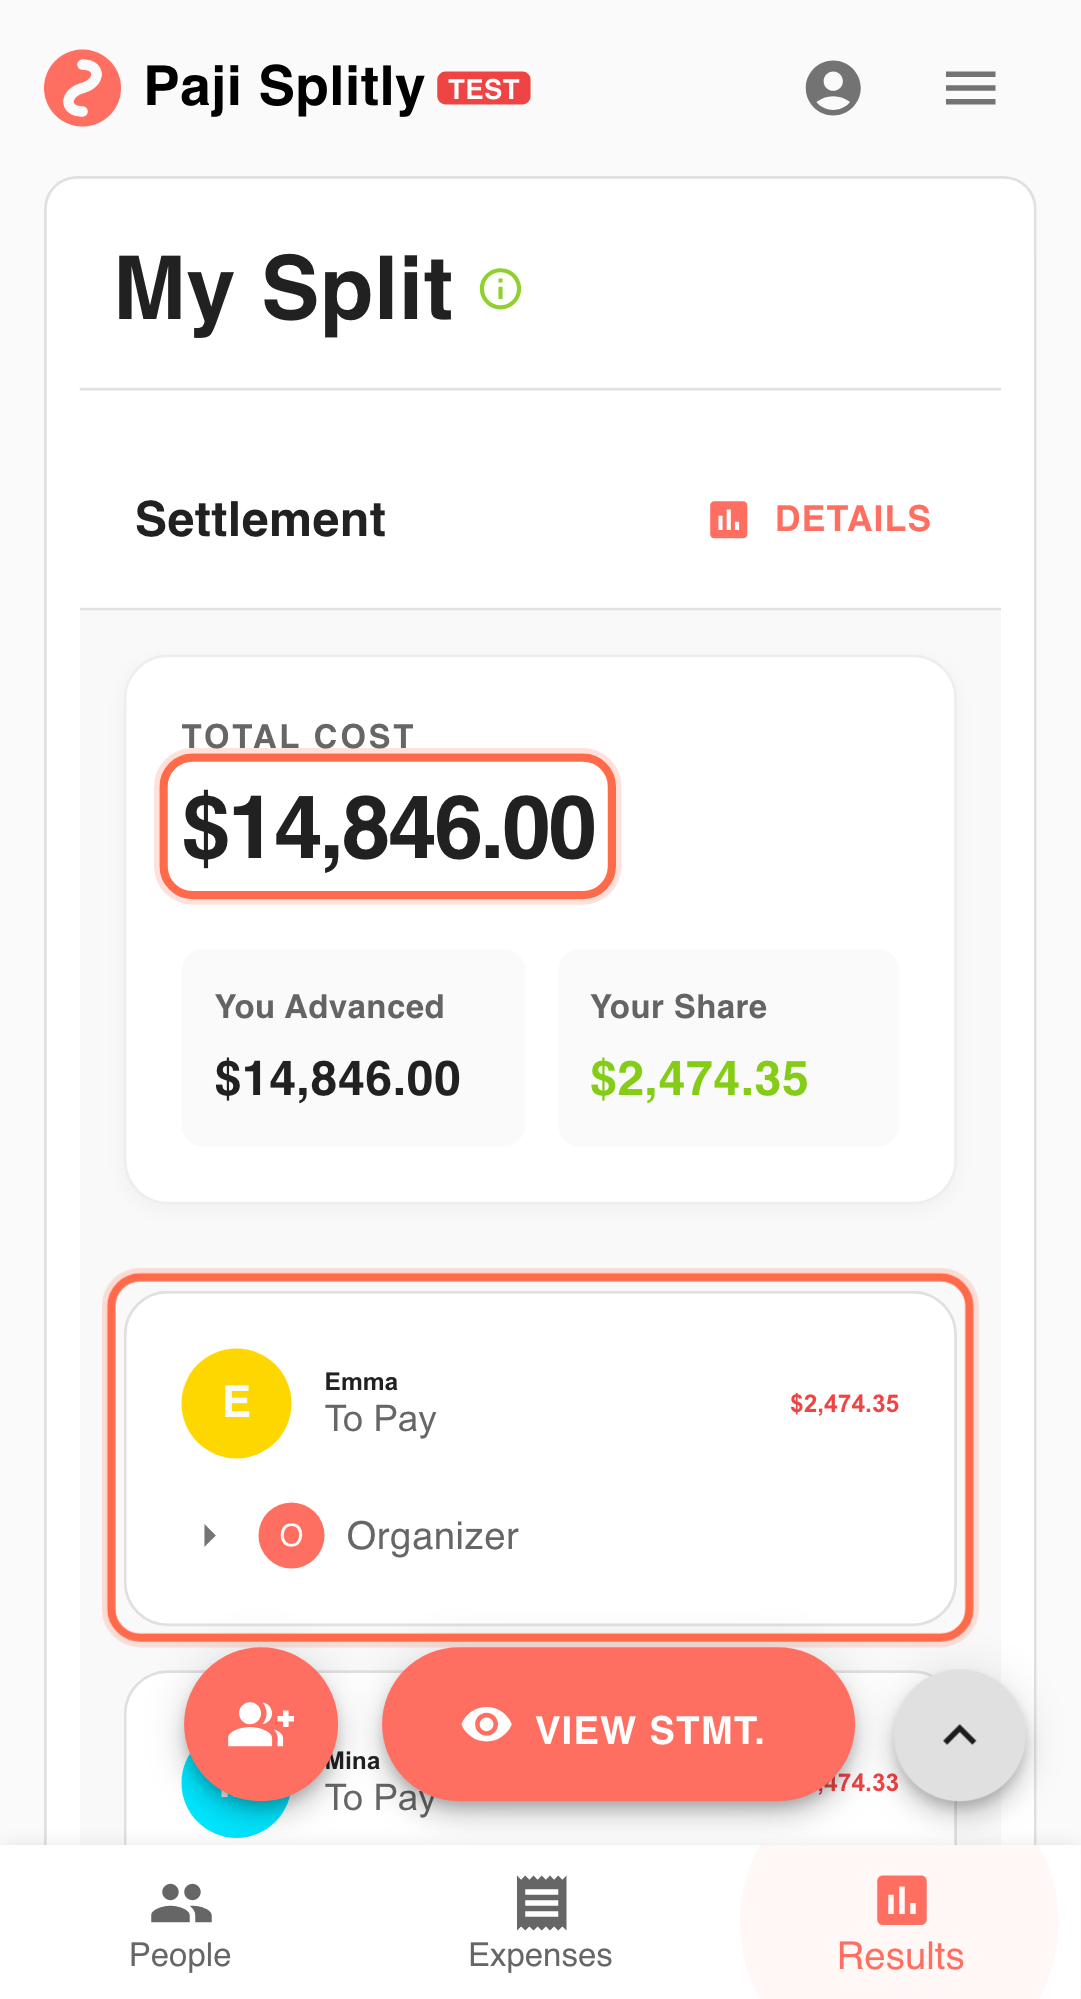
In last week's review ritual, 3 project bills totaling $27,400 were summarized with charts and exported records in about 10 minutes for manager updates.
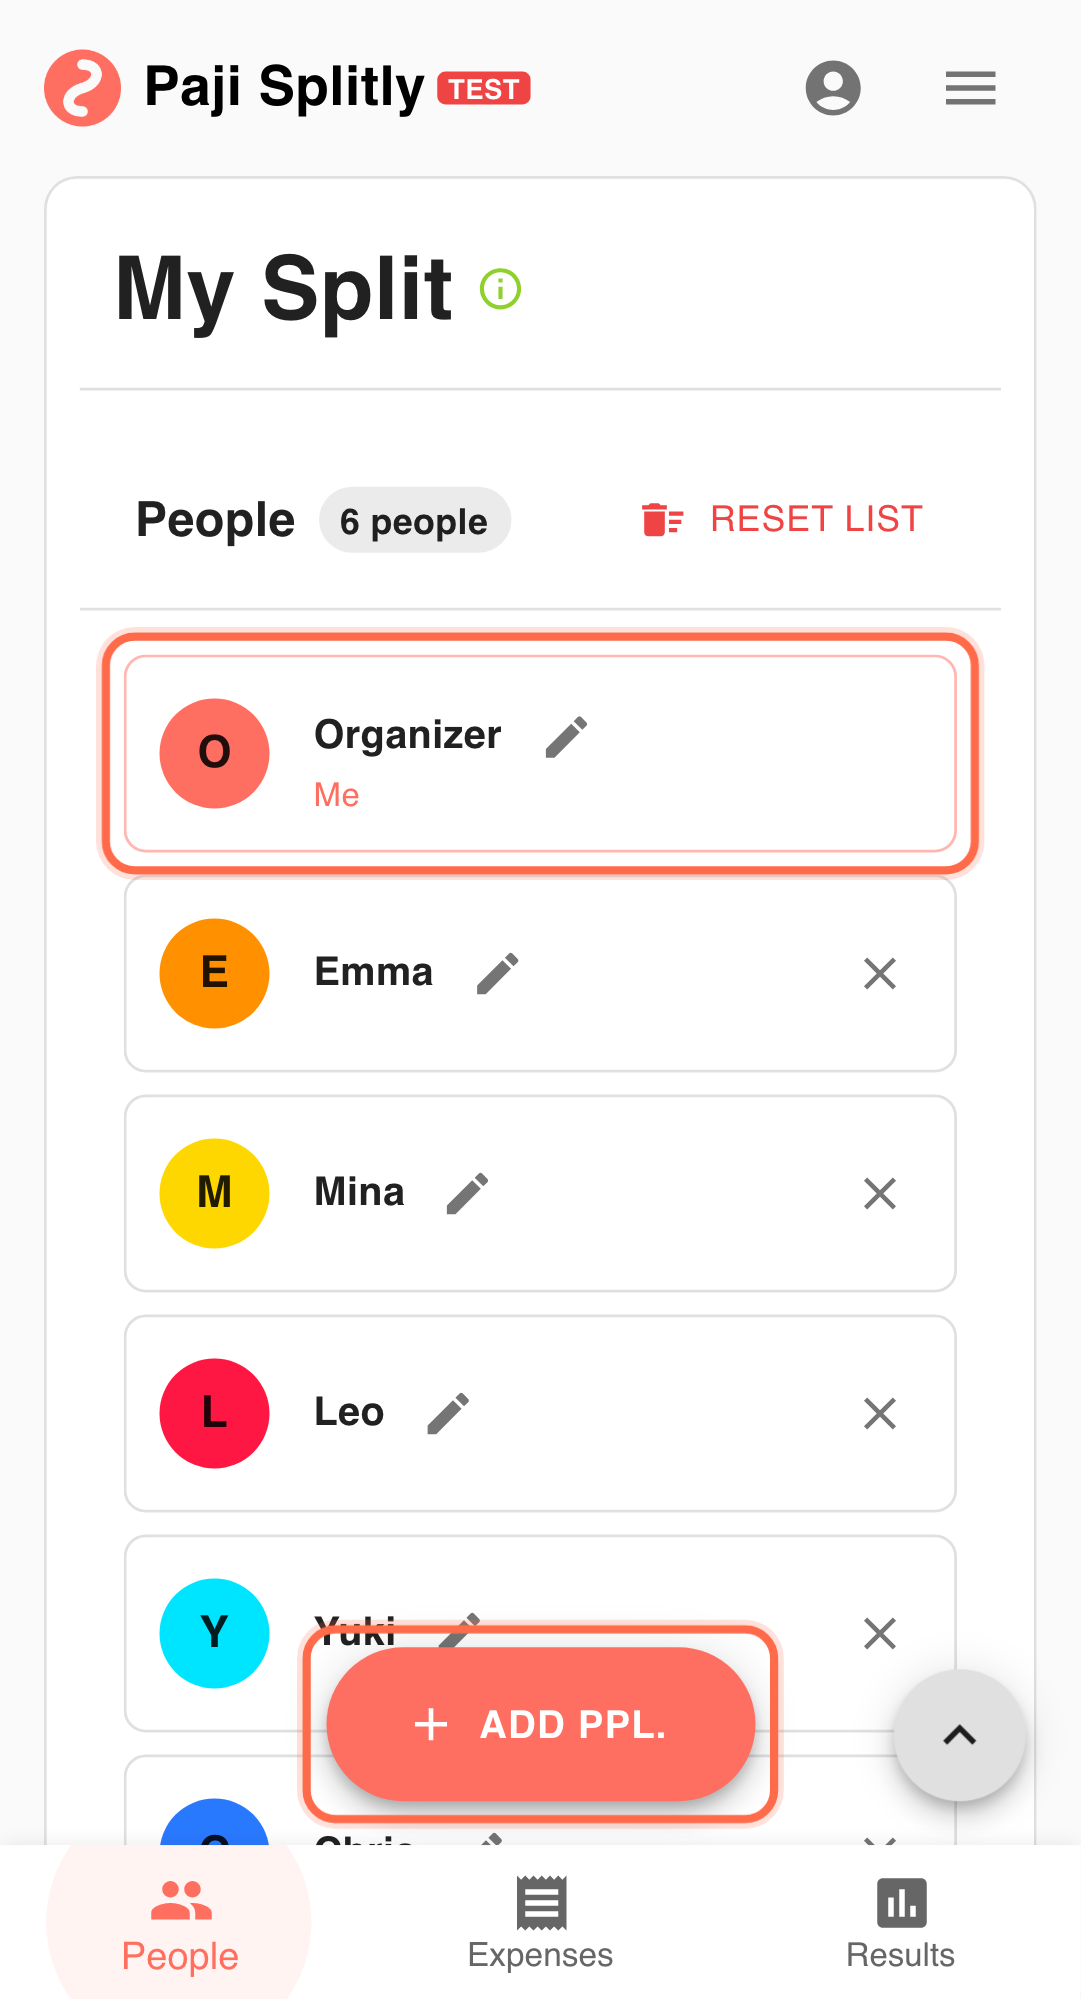
- You coordinate split-bill operations for a small team.
- Weekly expenses include meals, transport, and shared purchases.
- You want early warnings before month-end pressure builds.
A Repeatable 15-Minute Weekly Control Loop
- Review Detailed Charts on a fixed weekly day. Consistent timing keeps trend comparisons meaningful. This step should stay short and decisive. If it goes past 3 minutes, inspect entry consistency first.
- Investigate unusual categories through bill-level Results. Distinguish natural variance from data quality issues before reacting.
- Build a focused unresolved-items follow-up list. Prioritize high-impact unresolved items instead of broad reminder spam.
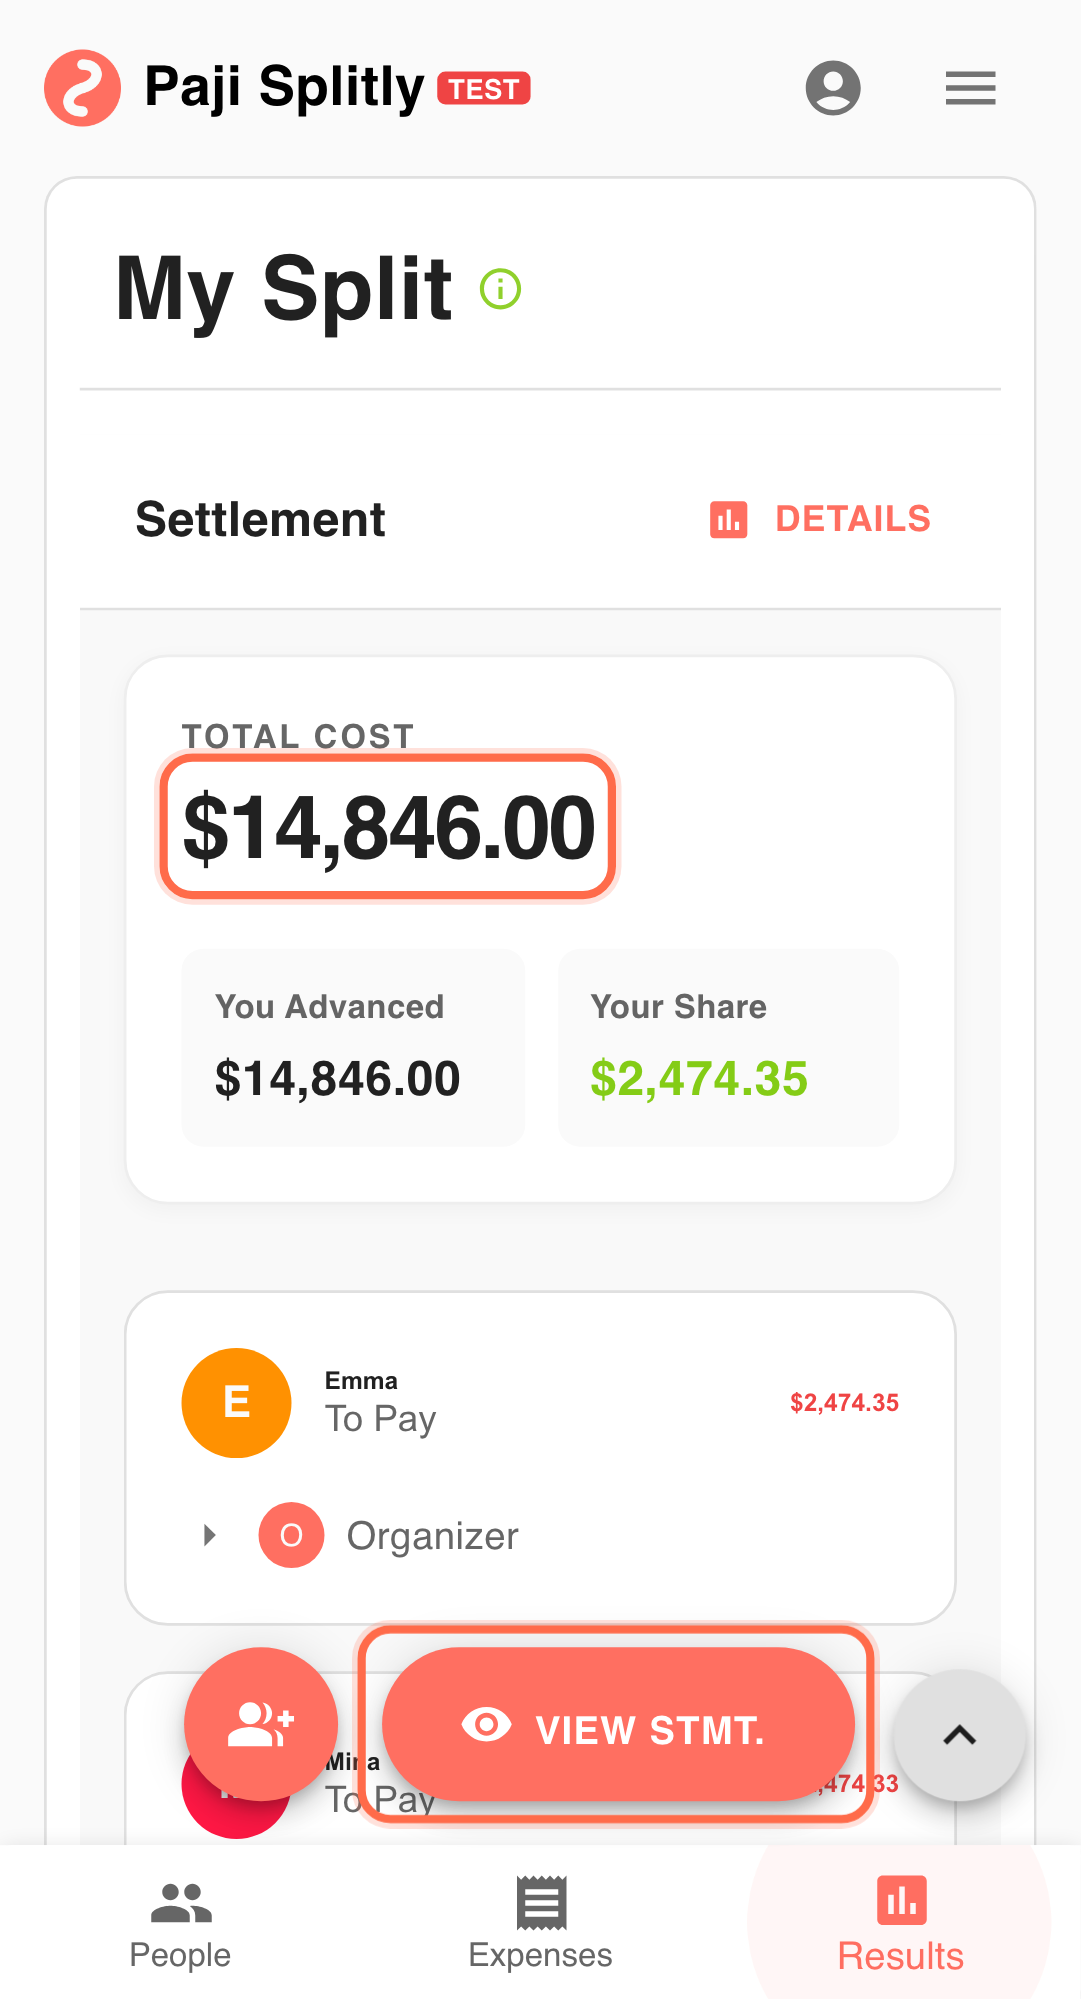
- Use Export Bill (Premium) to generate report material. Include a short summary: what changed, why, and what to do next.
- Compare current week vs prior week in the next review cycle. Recurring anomalies across weeks usually signal process issues, not one-off misses.
Pre-Publish Weekly Report Checks
- If a category spike shows up in Detailed Charts (e.g., transport doubling week-over-week), open the source bill and verify it is a real increase and not a duplicate or miscategorized entry.
- Confirm that all bills contributing to this week's data have been updated — an incomplete bill will make the exported report understate actual spending.
- Before exporting, attach a one-line note to each flagged anomaly explaining whether it needs action or is expected variance, so the reader does not have to guess.
Communication Style That Drives Action
- Structure the weekly report as three short sections — this week's totals, anomalies worth investigating, and follow-up owners with due dates — so readers can scan it in under two minutes.
- When an anomaly carries over from the previous week, call it out explicitly ("still unresolved from last week") to prevent it from quietly becoming accepted as normal.
- Send the report on the same day and time each week; inconsistent timing trains the team to ignore it.
Weekly Cadence Turns Data Into Control
Sustainable split management needs cadence. Detailed Charts detects early signals, and Export Bill turns them into actionable weekly reporting.
Common Weekly Reporting Risks and Mitigations
- Risk 1: A chart anomaly triggers unnecessary alarm because it reflects a one-time event (e.g., a team dinner) rather than a trend. Mitigation: always check whether a spike comes from a single large entry before escalating it as a spending problem.
- Risk 2: The weekly report becomes a routine attachment that nobody reads, so real issues go unnoticed. Mitigation: keep the report short, lead with action items, and follow up on last week's unresolved items in the next team sync.